
Covid-19 Cases Prediction-ML
Started: 2026-01-01
About this project
🦠 Covid-19 Cases Prediction – Machine Learning Project
Author: Leon Motaung
Technologies Used: Python, Pandas, NumPy, Matplotlib, Plotly Express, Facebook Prophet, Scikit-learn
🔍 Objective
The objective of this project is to analyze the global spread of Covid-19 and predict the number of confirmed cases for the next 30 days using time-series forecasting. The project combines data analysis, visualization, and machine learning to understand trends and future patterns of the pandemic.
🚀 Steps I Took
- Created a Python virtual environment:
python -m venv wenv
- Installed required libraries:
pip install pandas numpy matplotlib plotly fbprophet scikit-learn
- Loaded global Covid-19 confirmed cases and deaths datasets.
- Cleaned and aggregated country-level data.
- Prepared time-series data for global daily cases and deaths.
- Visualized worldwide spread and daily trends.
- Applied Facebook Prophet to forecast cases for the next 30 days.
📊 Data Visualizations
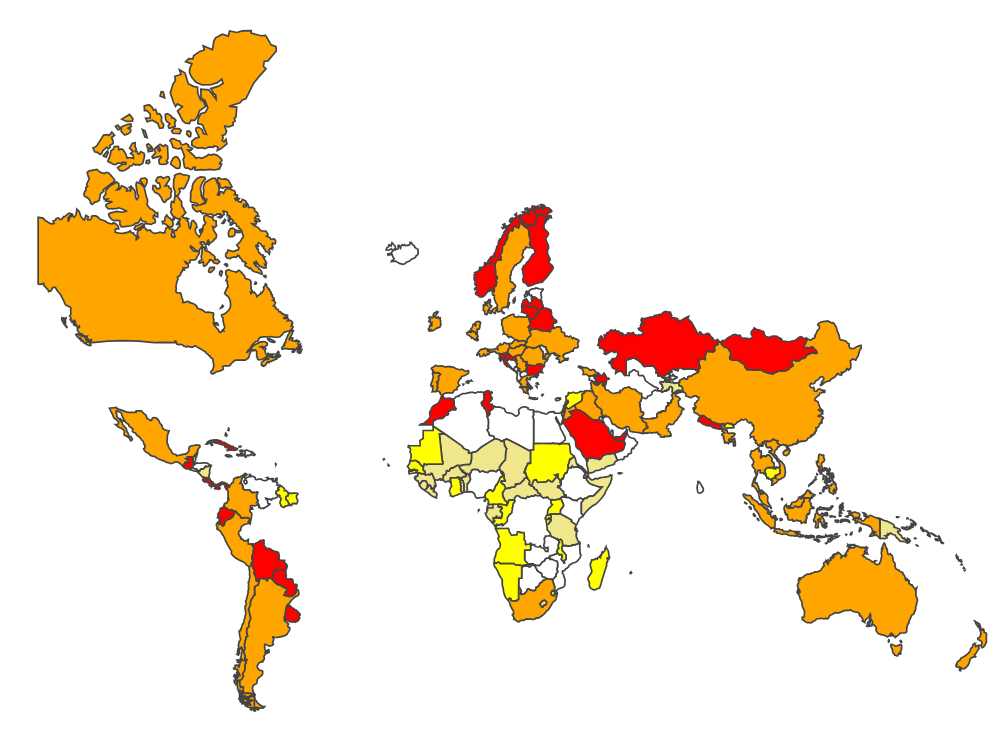
🌍 Worldwide Spread of Covid-19
A geographical choropleth map was created to visualize the global distribution of Covid-19 cases across countries.
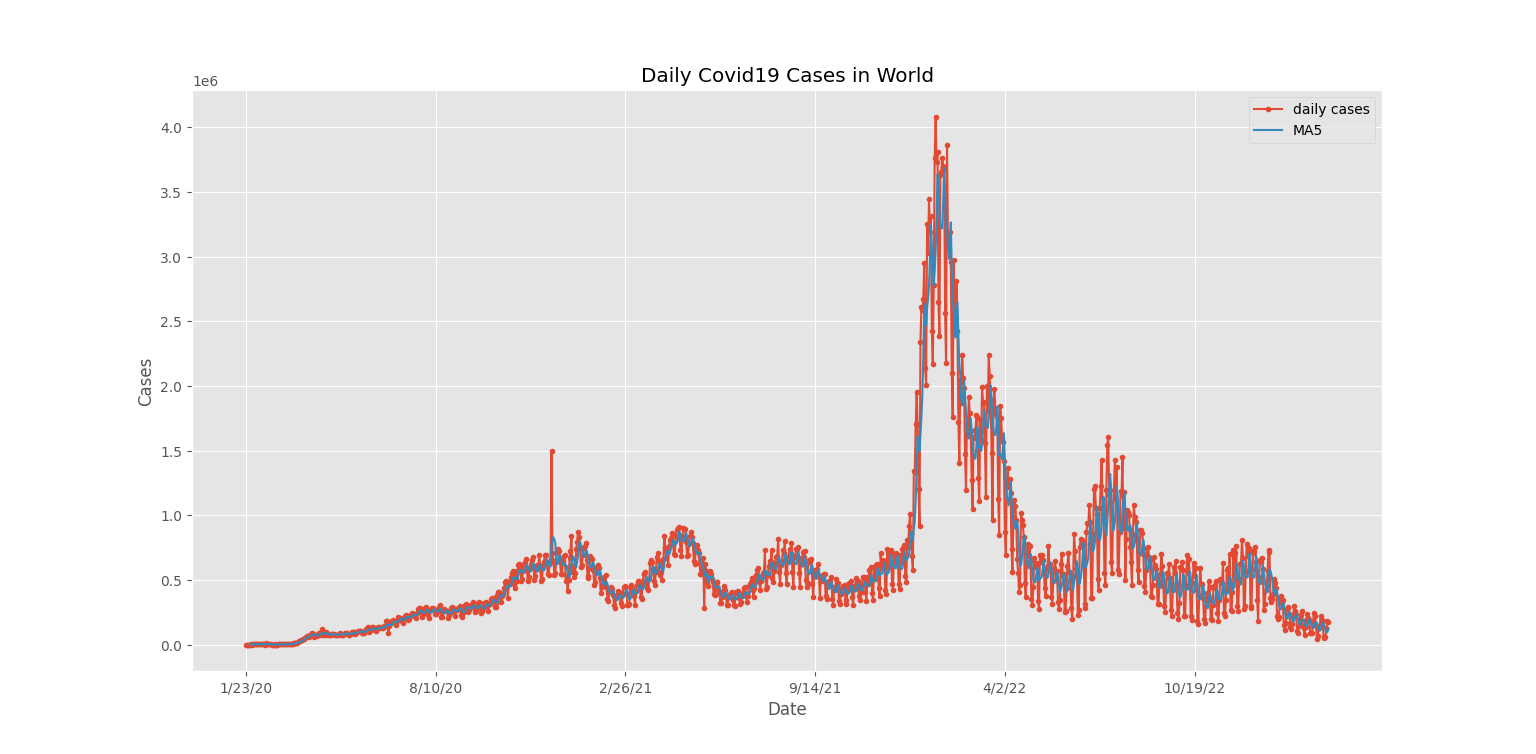
📈 Daily Global Covid-19 Cases
This visualization shows daily confirmed Covid-19 cases worldwide along with a 5-day moving average to highlight trends.
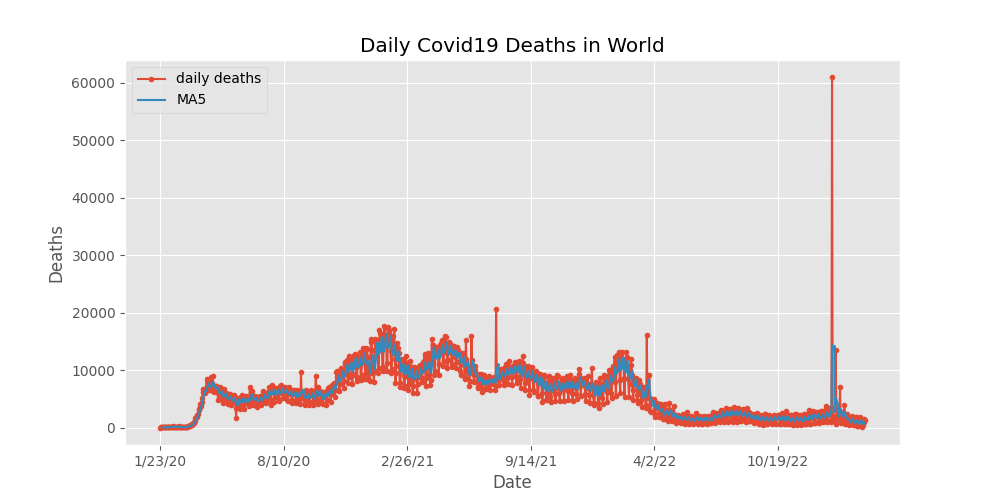
⚰️ Daily Global Covid-19 Deaths
This chart displays daily reported Covid-19 deaths globally, helping to understand mortality trends over time.
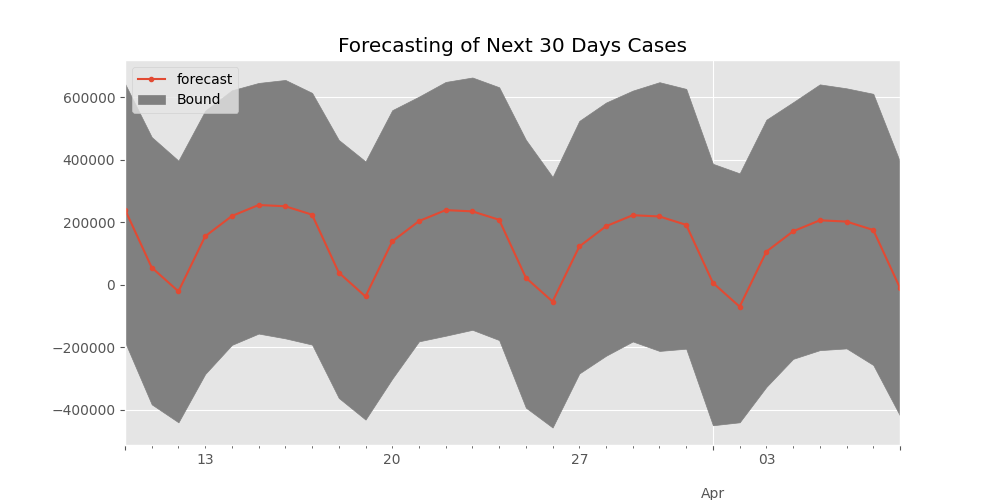
🤖 Covid-19 Cases Prediction (Next 30 Days)
Using the Facebook Prophet time-series forecasting model, the system predicts global Covid-19 cases for the next 30 days. The model captures weekly seasonality and provides confidence intervals for future predictions.
🧠 What I Learned
- How to clean and merge large real-world datasets.
- How to visualize global data using geographical maps.
- How to analyze time-series trends with moving averages.
- How to apply Facebook Prophet for forecasting.
- How to evaluate model performance using the R² score.
📌 Key Insights from the Analysis
📊 Global Trends Are Clearly Time-Dependent
Covid-19 cases and deaths follow strong time-based patterns, making time-series forecasting an effective approach.
📈 Moving Averages Smooth Daily Noise
Applying a 5-day moving average helps reduce daily fluctuations and reveals the true trend of infections and deaths.
🔮 Forecasting Provides Decision Support
The 30-day forecast offers valuable insight for planning and awareness, showing both expected case numbers and uncertainty bounds.
📂 Project Structure
data/– Covid-19 confirmed cases and deaths datasetsscripts/– Python scripts for analysis and predictionvisuals/– Generated plots and mapscases1.png– Daily global cases visualizationcases2.png– Daily global deaths visualizationcases3.png– 30-day Covid-19 cases forecast
🔥 This project strengthened my skills in data analysis, visualization, and time-series machine learning using real-world global health data.